

What do the agencies do with your HMDA data? The answer: they map it.
We saw firsthand how the agencies use maps to prove redlining at the annual Interagency Fair Lending Webinar. As the Federal Deposit Insurance Corporation (FDIC) put it, “a picture” of your financial institution’s mortgage lending patterns “is worth a thousand words.”
Let’s jump into the ways examiners use data visualization to track HMDA compliance and how you can deploy maps to tell your fair lending compliance story.
Table of Contents
Mapping your growthHow census data impacts your fair lending map
Will the Community Reinvestment Act (CRA) Final Rule change assessment area maps?
Telling your fair lending compliance story with maps
Mapping your growth
When your financial institution grows by adding new branch locations, loan offices, or infrastructure (such as ATMs), it calls for a celebration. But as you expand banking services to new consumers, you must be mindful of how this impacts your reasonably expected market area (REMA) – your assessment or market area for short.
Examiners pay close attention to your institution’s history of branch openings, closings, and relocations, especially regarding possible redlining.
A Los Angeles bank learned this lesson the hard way when it settled a $31 million redlining suit brought by the Department of Justice (DOJ) in early 2023. As the bank grew, it concentrated its lending activity in wealthy areas.
The DOJ plotted the bank’s mortgage applications on a map.
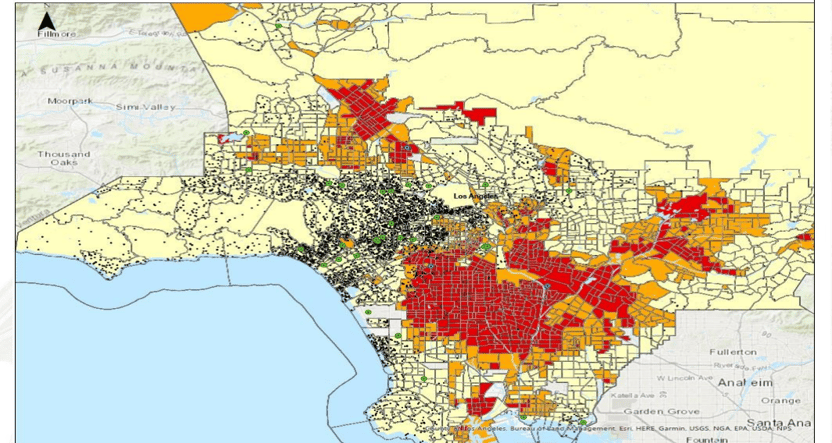
The orange and red areas of the map show majority-minority census tracts in the bank’s assessment area. The black dots represent mortgage applications from 2017 to 2020, and the green dots reveal the 11 new branch locations the bank opened over the past twenty years.
Agencies map HMDA data because visualization enables them to assess fair lending compliance more accurately. The concentration of black dots in majority-white, higher-income neighborhoods compared to majority-minority census tracts suggests redlining.
Financial institutions need a growth strategy that considers both profitability and compliance. Closing, opening, or relocating locations or altering delivery channels requires a holistic approach: how will these changes impact your FI’s bottom line and its fair lending risk exposure? How will you mitigate fair lending risk if your facilities become too concentrated in wealthy areas?
How census data impacts your fair lending map
Banks and credit unions must account for shifts in the demographics of census tracts in their market area. Census tracts are smaller than counties – ideally consisting of 4,000 people but ranging anywhere from 1,800 to 8,000 people. Examiners will note if you exclude majority-minority and low-to-moderate income tracts in your market or assessment area.
Related: Changing Census Tracts and the Impact on Your Fair Lending Analysis
As neighborhoods evolve, a census tract in your FI’s areas may become majority-minority. These changes impact fair lending compliance.
Let’s look at two maps presented during the Interagency Fair Lending webinar to observe the importance of demographic change.
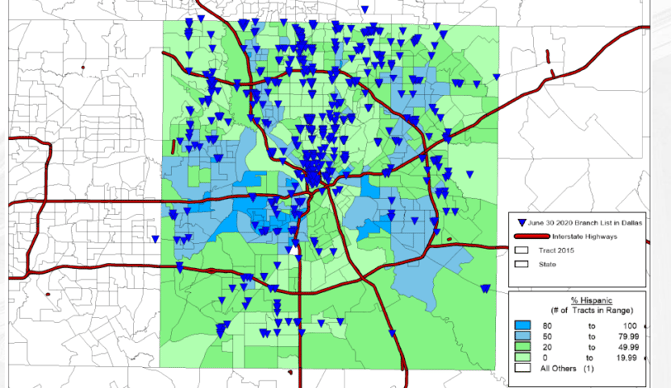
The above map shows branch locations for a Dallas bank’s assessment area according to the 2015 American Community Survey (ACS) data. Official U.S. census data is collected every 10 years, but the ACS collects census data yearly.
Dark blue areas on the map are census tracts in a county with a Hispanic population greater than 80%. Light blue areas are tracts with a Hispanic population greater than 60%.
The map below shows the same county updated according to 2020’s official U.S. census data.
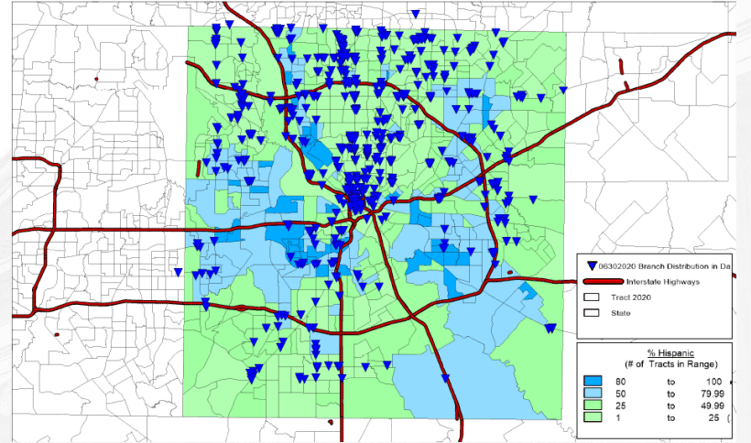
Notice anything?
The bank’s branch locations didn’t change, but the census tracts defined as majority-Hispanic grew considerably. Looking at the bottom right-hand corner of the map, examiners will notice that new majority-minority tracts in this county appear underserved by the bank.
If your financial institution relies on manual processes for fair lending analysis, you must keep track of demographic changes in census tracts. This type of analysis is difficult and time-consuming. But regulators will want to see what your institution is doing to provide loans and other banking services in majority-minority neighborhoods.
What marketing and outreach efforts do you have in these areas? Are you advertising banking services to these populations? Are you building partnerships with community leaders and institutions? How many loan officers does your FI assign to majority-minority tracts?
Regulators don’t expect you to build new branches, although they don’t want to see a history of concentrating branch locations in wealthy neighborhoods. They do expect your loan applications and originations in majority-minority and LMI census tracts to meet a threshold aggregated to comparable peer institutions in your assessment area.
Will the Community Reinvestment Act (CRA) Final Rule change assessment area maps?
During the webinar, the Office of the Comptroller of the Currency (OCC) emphasized that “CRA and fair lending are mutually reinforcing.” How did the CRA Final Rule change the assessment areas maps for CRA compliance and fair lending enforcement?
For the most part, CRA assessment areas remain facility-based. Examiners will look at the physical presence of your bank to determine the market area you can reasonably serve.
Under the new rule, larger banks (>$2 billion in assets) will no longer be able to consider partial counties in their assessment area maps. Smaller banks (< $600 million in assets) and intermediate-sized banks (between $600 million and $2 billion in assets) may still consider partial counties in their assessment areas if they have a good reason for doing so.
The CRA final rule also introduces the Retail Lending Test for large and intermediate-sized banks, expanding assessment areas for banks with at least 150 closed-end mortgages in MSAs and nonmetropolitan areas outside their facility-based assessment area.
Related: Community Reinvestment Act (CRA) Final Rule: Preparing Your Bank for CRA Modernization
Telling your fair lending compliance story with maps
If you’re not mapping home loan applications and originations in your assessment area, you can’t tell your compliance story to examiners. Since the DOJ launched its Combatting Redlining Initiative in 2021, it has secured more than $100 million in settlements nationwide.
The DOJ has told its story of fair lending noncompliance through mapping. The FDIC, OCC, Consumer Financial Protection Bureau (CFPB), and other agencies rely on data visualization as ammunition against housing discrimination.
It’s time for your financial institution to deliver its narrative.
With fair lending analytics software that offers interactive loan and applicant mapping by majority-minority and LMI census tracts, across roadways and into adjacent partial counties, and by zip code, financial institutions can proactively monitor for weaknesses in their fair lending compliance program.
Mapping empowers you to devote additional resources – lending officers, marketing and outreach programs, and financial literacy initiatives – to the communities in your geographic reach that need them most.
It offers visual proof to examiners and enables you to meet the banking needs of your people.
Map your fair lending story
