

Regulators continue to prioritize Redlining compliance. In this post, you will learn more about the regulators' perspective, why they say data analysis is essential for Redlining risk management, and learn key questions you need to ask about your Redlining risk.
We will focus on 5 key questions every lender needs to answer to understand their redlining compliance risk, and show you how you can find the answers.
 Over the past two years, Redlining has consistently been in the news as a top priority for the regulators.
Since 2015, financial institutions have agreed to pay more than $249M in redlining-related settlements. Still more institutions are involved in lawsuits, pending settlements, and other enforcement actions.
Just this April, the Consumer Financial Protection Bureau released their fifth annual Fair Lending report, which listed Redlining as one of three top priorities (the other two were small business lending and servicing for mortgage and student loans).
While the CFPB may face an uncertain future, the Bureau remains a leading regulatory entity that provides insight to financial institutions.

By evaluating the CFPB's actions and priorities, we can anticipate that other regulators and lawmakers at the federal and state level might follow their example.For example, in 2015, New York's Attorney General settled a Redlining case with a bank.
What does this pressure mean for lenders trying to manage their Redlining risk? Analyzing your data for Redlining risk has never been more important.
"Institutions with strong compliance programs examine lending patterns regularly, look for any statistically significant disparities, evaluate physical presence, monitor marketing campaigns and programs, and assess CRA assessment areas and markets more generally."
- CFPB, 2016 Fair Lending Report
Redlining analysis should prompt and answer the following questions, as noted by the CFPB and other regulators:
- Do I know my REMA?
- Am I analyzing lending patterns, such as application and origination rates?
- Do I have a clear understanding of my Fair Lending and CRA risk exposure?
- Elevated risk in one of both of those areas may attract regulatory attention.
- Do I know how my performance compares to my peers?
- Does my analysis indicate that geographic areas with high proportions of low-income, and/or high-minotiry individuals, are treated less favorably than the control group?
There are other questions to consider, but these few are a strong starting point, particularly if managing Redlining compliance is new to you.

Answering these questions is essential, but that doesn't mean it's always easy. Redlining analysis with a great Redlining software will provide you the answer to these questions and more that are related to your compliance performance.
1. Do I know my REMA(s)?
Your REMA(s) will be defined by your regulator, but it determined with an understanding of your business. However, you can estimate a REMA for your internal Redlining analysis and risk management.
A dedicated compliance partner, like TRUPOINT, will work with you to determine an estimated REMA. After defining a potential REMA, it's a good idea to share that with your regulator so that you can make sure you're all on the same page.
Note: An earlier post, 7 Regulator-Approved Facts about REMAs, will answer some of your key questions about REMAs if you're a little confused or would simply like to learn more.
2. Am I analyzing lending patterns, such as origination and application rates?
Analyzing your data for Redlining risk is essential. However, for most institutions, it's too difficult to do internally. That's why a Redlining analysis software is a great addition to your compliance program.
When you analyze your data, ensure that you're looking at marketing and underwriting risk by evaluating applications and originations. Redlining Analytics from TRUPOINT makes assessing your Redlining risk in those key areas simple.
In the platform, there are three primary dashboards that illustrate your risk: Marketing, Underwriting and Peer. Each dashboard has multiple ways to review the data, plus advanced filtering. Here is a map that shows one of the maps within the Marketing dashboard. You can see the filters on the right:
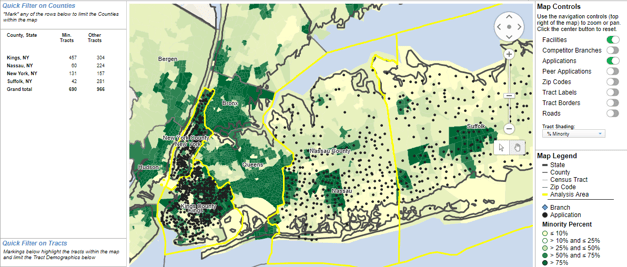
That's just one quick snapshot of the platform. (If you'd like to learn more about how it can work for you, click here.)
3. Do I have a clear understanding of my Fair Lending and CRA risk exposure?
As the CFPB noted in their annual Fair Lending report, examiners usually assess Redlining risk at the intial phase of a Fair Lending or CRA exam. They will use HMDA and Census data. Peer analysis is usually involved in this process to evaluate how your performance compares to others in your market.
As you can tell, analysis is a first step for the regulators in determining Fair Lending, CRA and Redlining risk exposure. It should be a first step in your compliance risk management, too. In this regulatory environment, you can't afford not to know your numbers.

Fortunately, the TRUPOINT Analytics software has subscription modules for Fair Lending, CRA and Redlining. Not only does that make it easier to gain a complete understanding of your risk, it also means that if risks are identified, they're easy to investigate. In addition, the compliance expert who guides you through your report reviews would also have insights about other areas of compliance and your risk.
Learn more about Fair Lending, CRA and Redlining Analytics here.
4. Do I know how my performance compares to my peers?
An accurate understanding of your Redlining risk must include analysis of your institution's performance compared to peers. As mentioned above, it will be one of the first factors the regulators evaluate.
TRUPOINT Analytics simplifies peer analysis. As a subscriber to the Redlining Analytics software, you would not only be able to visualize how your performance compares to peers using filters, you would also get a deep dive into the peer makeup of your market.
The image below provides a closer look at some of the available filters:
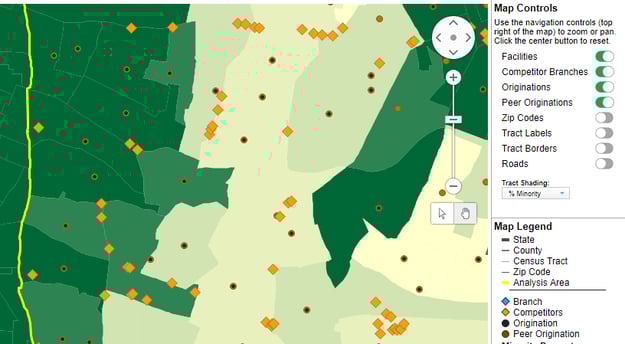
In the map, the orange diamonds are competitor locations, while the brown dots are competitor originations and the black dots are your originations.
In that dashboard, you would see a list of all lenders within your defined Assessment Areas. From there, it's simple to filter the list using factors such as application volume.
5. Does my analysis indicate that geographic areas with high proportions of low-income, and/or high-minority individuals, are treated less favorably than the control group?
This is the question at the heart of Redlining analysis. Are you providing equal access to credit and equal terms of credit to all similarly situated individuals, regardless of the area in which the individual resides or their mortgage would be?
Redlining analysis is designed to answer this fundamental question. TRUPOINT's Redlining Analytics makes answering that question easy. Click the button below to sign up for a free demo today:
TRUPOINT Viewpoint: Redlining compliance is important today, and will likely be even more important in the coming days, weeks, months and years. Effective Redlining compliance risk management will rely on analysis.
Redlining Analytics can help identify potential Redlining risk exposure, allow you to stand in the examiners' shoes and see what they see, and also ensure that your good efforts to improve are working as intended.
While we'd love the opportunity to show you how Redlining Analyticscould work for you, you may prefer to first look over a free sample report that would guide you through some key features of the software. Which would you prefer?
Or get in touch if you have more questions!